 _s where the
spectrum steepens from spectral index
  to spectral index
  +1 due to synchrotron losses, as in the
normal KP model. There will in addition be a second exponential cutoff
at a frequency
  _e due to
inverse Compton losses. If inverse Compton losses dominate then only
the exponential cutoff will be seen and it doesn't matter whether
there's any pitch angle scattering. If the synchrotron losses dominate
then
  _e >
_e >  _s and a steeper power law segment would be
seen between the two break frequencies.

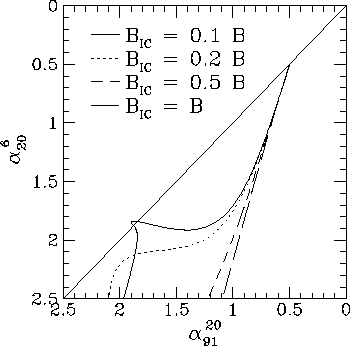
Figure 4. Loci in the colour-colour plane for constant field KP model radio spectra, for the set of frequencies (6, 20, 91) cm. Four curves are shown in which the importance of inverse Compton losses varies, as given by the ratio of the inverse Compton equivalent field B_IC to the rms field strength B.

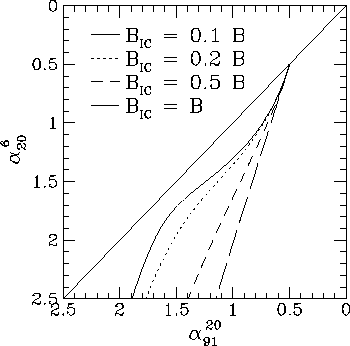
Figure 5. Loci in the colour-colour plane for random field KP model radio spectra, for the set of frequencies (6, 20, 91) cm. Four curves are shown in which the importance of inverse Compton losses varies, as given by the ratio of the inverse Compton equivalent field B_IC to the rms field strength B.
I show colour-colour plots in Figs 4 and 5 for these modified KP models. Models with both constant (Fig. 4) and random (Fig. 4) magnetic field strengths are shown. What is interesting here is that the colour-colour plot, at least for the random field model, is not very different from that of models with pitch angle scattering. The constant field KP model spectra are not realistic, as there will be variations in the field, but a comparison of Fig. 4 and Fig. 5 shows that differences between the constant and random field models are readily apparent.
Comparing Fig. 1 and Fig. 5, on the other hand, shows that in realistic models the effects of a random magnetic field, diffusion, and inverse Compton losses are more important than the pitch angle distribution in determining the shape of the colour-colour locus. It appears that it would be very difficult in practice to differentiate between the KP and JP prescriptions for the pitch-angle distribution.
On to:
___________________________________ Peter Tribble, peter.tribble@gmail.com