 between two frequencies
against the spectral index between a different frequency pair.
Katz-Stone et al. (1993) used three frequencies (
 _1,
_1,  _2,
_2,  _3) and plotted
  (
( _1,
_1,  _2) against
  (
( _2,
_2,  _3).
_3).
The radio colour-colour diagram is a plot of the radio spectral index
 between two frequencies
against the spectral index between a different frequency pair.
Katz-Stone et al. (1993) used three frequencies (
 _1,
_1,  _2,
_2,  _3) and plotted
  (
( _1,
_1,  _2) against
  (
( _2,
_2,  _3).
_3).

Figure 1. Loci in the colour-colour plane for three-dimensional random field radio spectra, for the set of frequencies (6, 20, 91) cm.
In Fig. 1 I show the loci traced out in the colour-colour diagram by some of the spectra presented in Paper I, for various values of the diffusion coefficient D. These spectra are for a three dimensional random field with efficient pitch angle scattering. The set of frequencies used is 6 cm, 20 cm, 91 cm, to correspond with the diagrams presented by Katz-Stone et al. (The actual frequencies aren't important, of course, it is just the ratio of the frequencies that matter.) The diffusion coefficient D is defined so that the total energy losses of an electron are due to an effective magnetic field strength given by
<B^2>_eff = D <B^2>_electron + (1-D) B^2, (1)
which comprises a fraction D due to the average magnetic field
the electron has encountered, and a fraction (1-D) due to the
instantaneous magnetic field in which the electron is currently
radiating. The actual losses average over pitch angles so the total
loss term is <B^2sin^2 >=(2/3)<B^2>_eff. I
assume in these simple models that the average field (given by
<B^2>_electron) sampled by each electron is the same as
the root mean square magnetic field B_rms. In reality, an
electron will not fully sample the field distribution, so that this
description is oversimplified. More sophisticated and realistic
diffusion models are considered later, in Section
5. Inverse Compton losses can be included by adding them to the
average magnetic field component, or increasing the value of D
appropriately.
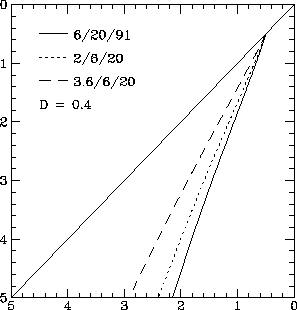
Also presented, in Figs 2 and 3, are colour-colour diagrams for three different sets of observing frequencies. As can be seen, while changing the set of observing frequencies moves the colour-colour loci around in the colour-colour plot, it does not change the overall shape or the features that are present. The motion of the colour-colour locus is as expected - for example, comparing the sets of frequencies (2,6,20) cm and (3.6,6,20) cm in Fig. 2, the spectrum steepens monotonically in these simple models so that the spectral index between 2 cm and 6 cm is steeper that the 3.6-6 cm spectral index, which moves the colour-colour loci of the (3.6,6,20) cm up slightly. In Fig. 2, the spectrum is very close to the JP model, and changing the set of observing frequencies changes the slope of the colour-colour locus.
An important point that can already be seen from these simple models is that the random field spectra give a much better description of the Cygnus A data (Katz-Stone et al. 1993) than either the simple KP or JP model spectra. Although the fit is not perfect, the random field spectra do have the right shape. This overall shape is given generically by models that average over a range of physical conditions in the source.

Figure 2. The variation of the colour-colour loci in the colour-colour plane for three-dimensional random field radio spectra with D=0.05, for three different sets of observing frequencies.

Figure 3. The variation of the colour-colour loci in the colour-colour plane for three-dimensional random field radio spectra with D=0.4, for three different sets of observing frequencies.
The loci traced out in the colour-colour plane by the different models, although varying in detail, tend to have a fairly standard form. The locus starts out on the diagonal line, with both spectral indices equal, corresponding to a pure power-law spectrum. The locus then falls, usually curves back towards the diagonal line, and then reverses to fall again as the spectrum steepens. I refer to the region where the locus curves back towards the diagonal line as the parallel section. In the JP models, and the models with efficient diffusion, the parallel section is essentially absent. The KP model returns to the diagonal line, with a steeper power-law slope, while the JP model falls straight off the diagram, with a slope determined by the set of observing frequencies.
On to:
Up to: ___________________________________ Peter Tribble, peter.tribble@gmail.com